How The Process Works
Many non-profit organizations collect data on a variety of sources during the normal course of operations, including details on funding sources, campaigns, resource allocation and the clients they serve. Balance sheets are usually administered electronically in a GL, and there may be other systems for example, to track inventory, coordinate logistics or manage contacts. Over time all such systems accrue vast amounts of data that can potentially support the organization’s strategic decision making – but for many, there can be impediments to converting it into valuable, insightful information. Challenges typically revolve around two key constraints, the skill required to free the data, and the ability to transform it into meaningful analytic results.
Small to mid-sized orgs may lack sufficient technical capacity or acumen to extract data from the sometimes complex, often proprietary data formats that reside behind software applications. Although it is common to find report-generating functions within these apps, they tend to be ‘canned’ and not customizable, best suited for conveying operational status. These disparate systems are rarely integrated, making it difficult to draw inferences based on the entire data landscape. These limitations conspire to constrain analysis to tactical decision making rather than enabling a path to broader strategic insight.


Our experienced team of technical geeks is well-versed in the dark art of data extraction and transformation. There is usually a way of extricating an application’s data from its byzantine underpinning of columns and rows, either by exporting to text files, or through a native data export interface.
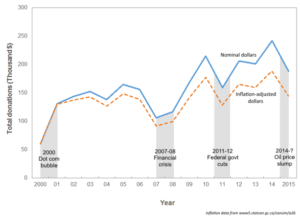
Once in a consistent format, data sets from different applications can be blended for a more holistic analysis. Curious about which funding drives are the most efficient revenue generators? We’ll mash up your general ledger with your campaign data. Wondering about the impact of seasonality on your donor base? We can do time series analysis, and even work out a forecast when there is sufficient data.
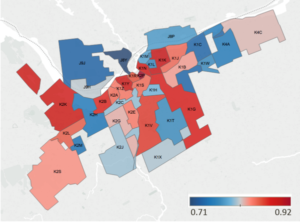
In-house data can combined with external, open sources such as census and economic data from government repositories like StatsCan. On past engagements, clients have been interested in understanding how to better target their donor base. We can mash up contribution amounts with demographic data and plot cartographic ‘heat maps’ using various measures, including population density and household income.
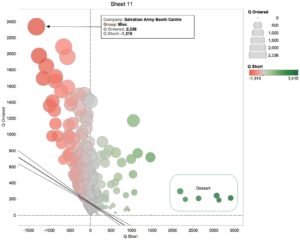
As a picture can be worth a thousand words, the output of our analysis made up primarily of different types of visualizations. We use several types of tools ranging from Excel and Tableau to produce charts and dashboards, to more sophisticated statistical software packages like R and SPSS for regression and time series analysis.
D4GO can assist in a variety of ways depending on your needs. The engagement begins with a consultation to assess how best we can add value and the feasibility of getting there. A standard prerequisite is that all primary sources of data are obtainable in electronic format. Expectations of inferential value are contingent data quality and completeness. In the majority of cases, the data must be ‘cleansed’ of personal identifiers. All of these factors are discussed during the initial consultation with the Data Ambassador. From here, the client may elect to go forward with an actual analysis, or defer pending further contemplation.


It is worth noting that there do not necessarily have to be any specific business questions in mind at the time of the engagement. It is quite often the case that D4G is brought in for an undirected general exploration of trends and other interesting correlations that exist within the data. Usually this will illuminate the analysis path by prompting interest in drilling down deeper into specific subjects. Regular checkpoints with the client ensure that the ‘wheat’ remains separated from the ‘chaff’.
So engage us. We’re actually pretty nice people, with a whole lot of accrued expertise in analytics. …and we come free of charge.
